INTRODUCTION
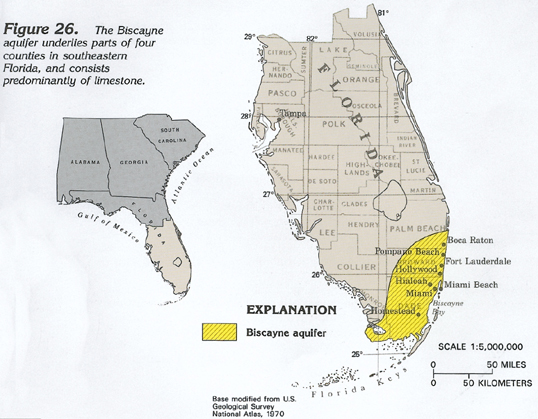
The Biscayne aquifer underlies an area of about 4,000 square miles and is the principal source of water for all of Dade and Broward Counties and the southeastern part of Palm Beach County in southern Florida (fig. 26). During 1985, an average of about 786 million gallons per day was withdrawn from the Biscayne aquifer for all uses; pumpage at present (1990) is somewhat greater. About 70 percent of the water was withdrawn for public supply. Major population centers that depend on the Biscayne aquifer for water supply include Boca Raton, Pompano Beach, Fort Lauderdale, Hollywood, Hialeah, Miami, Miami Beach, and Homestead. The Florida Keys also are supplied primarily by water from the Biscayne aquifer that is transported from the mainland by pipeline.
Because the Biscayne aquifer is highly permeable and lies at shallow depths everywhere, it is readily susceptible to contamination. The aquifer is the only source of drinking water for about 3 million people.
Water in the Biscayne aquifer is under unconfined, or water-table, conditions and the water table fluctuates in direct and rapid response to variations in precipitation. The aquifer extends beneath Biscayne Bay, from whence it was named, and the Atlantic Ocean. The aquifer is highly permeable where it forms part of the floor of the bay and the ocean, and contains saltwater there. Some of this saltwater has migrated inland in response to the lowering of inland ground-water levels adjacent to canals constructed for drainage of low-lying areas and near large well fields.
HYDROGEOLOGIC UNITS
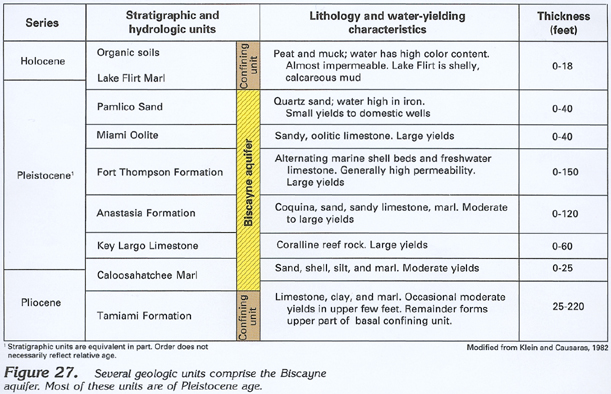
The Biscayne aquifer consists of highly permeable limestone and less-permeable sandstone and sand. Most of the geologic formations comprising the aquifer are of Pleistocene age but, locally, Pliocene rocks also are included in the aquifer (fig. 27).
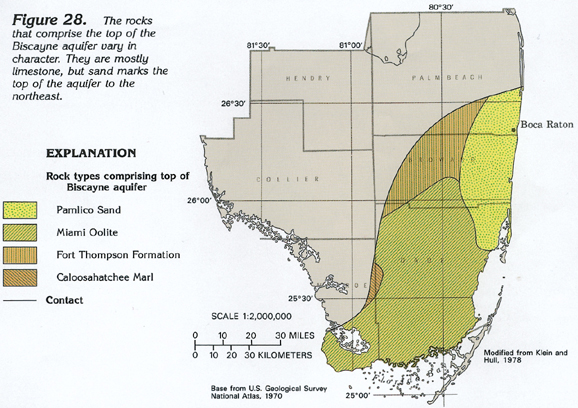
Most of the formations are thin and lens-like, and the entire sequence shown in figure 27 is not present at any one place. Some of the units interfinger and some are lateral equivalents of each other. For example, the Anastasia Formation and Key Largo Limestone interfinger with the Fort Thompson Formation; in places, the Miami Oolite is equivalent to the Key Largo Limestone and in other places to the upper part of the Fort Thompson Formation; and so on. The thickest and most extensive geologic unit in the Biscayne aquifer is the Fort Thompson Formation, which is the surficial unit in northwestern Broward County and part of Palm Beach County (fig. 28); this unit is the major water-producing unit of the aquifer. The Anastasia Formation comprises much of the Biscayne at Fort Lauderdale and northward into Palm Beach County. However, the Pamlico Sand is the surficial unit in this area (fig. 28). The Miami Oolite, although thin, is a very porous, oolitic limestone that is present at the land surface throughout much of Dade County and parts of Broward and Monroe Counties (fig. 28). In general, the entire aquifer is more sandy in its northern and eastern parts, and contains more limestone and calcareous sandstone to the south and west.
The Fort Thompson, Anastasia, and Key Largo Formations yield the most water of any of the geologic formations of the Biscayne aquifer. The Fort Thompson is the most used of these three units. At Fort Lauderdale, the Tamiami Formation is a productive aquifer where it consists of calcareous sandstone. Most of the water is obtained from solution cavities in the sandstone. Yields of as much as 7,000 gallons per minute are reported for some wells completed in the Tamiami Formation, and drawdowns in the wells are less than 10 feet. The Biscayne aquifer is most permeable in a band near the coast in Dade and Broward Counties, but a cavity-riddled zone in the northern part of the aquifer in Palm Beach County yields as much as 1,000 gallons per minute to wells.
The Biscayne aquifer grades northward and westward into sandy deposits that are part of the surficial aquifer system. Well yields from these sandy deposits are small compared to well yields from the Biscayne. A sequence of low-permeability, largely clayey deposits about 1,000 feet thick separates the Biscayne aquifer from the underlying Floridan aquifer system. The Floridan contains saltwater in southeastern Florida, and is not hydraulically connected to the Biscayne aquifer.
BASE AND THICKNESS
The base of the Biscayne aquifer in Dade County and southern Broward County is a low-permeability sandy silt that is part of the Tamiami Formation. Farther north, the base is not as distinct; rather, it consists of a transition zone that changes from a mixture of moderately permeable calcareous sand, shell, and silt, which probably are part of the Anastasia Formation, to low-permeability silty clay which is part of either the Anastasia or Tamiami Formations.
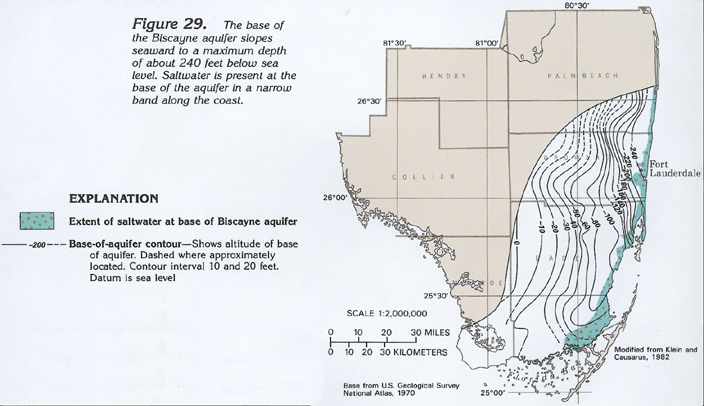
The altitude and configuration of the base of the Biscayne aquifer are shown in figure 29. The base is somewhat irregular but generally slopes seaward from the western limit of the aquifer, where it is at the land surface, to a depth of about 240 feet below sea level near Boca Raton. Throughout much of the mapped area, the top of the aquifer is at or near the land surface. Accordingly, thickness of the aquifer can be estimated by subtracting the altitude of the base of the aquifer from the altitude of the land surface at a given point. The aquifer is wedge-shaped and ranges in thickness from a few feet near its western limit to about 240 feet near the coast.
Saltwater locally has entered the Biscayne aquifer, mostly near its base. The approximate extent of saltwater encroachment in 1982 is shown in color in figure 29.
HYDROLOGIC SYSTEM
Ground water and surface water form an integrated hydrologic system in southern Florida. Before development of these water resources, a large proportion of the abundant precipitation that fell on the flat, low-lying area drained southward to the Gulf of Mexico and Florida Bay. Most of this drainage was in the form of wide, shallow sheets of water that moved sluggishly southward during the wet season, when as much as 90 percent of areas, such as the Everglades, was inundated. This drainage was the major source of recharge to the underlying aquifers. During the dry season, water moved only through the deeper sloughs and covered probably less than 10 percent of the Everglades. Lake Okeechobee, the second largest freshwater lake wholly within the conterminous United States, was a major water-storage component in the system, functioning as a retarding basin for streams, such as the Kissimmee River, that drained southward into the lake.
Today, the shallow, southward-moving sheet of surface water still is a major source of recharge to the Biscayne aquifer in addition to the precipitation that falls directly on the aquifer. Where the Biscayne is either exposed at the land surface or is covered only by a veneer of soil, the slowly moving surface water passing over the recharge area of the aquifer is able to readily percolate downward into the aquifer.
Freshwater Controls
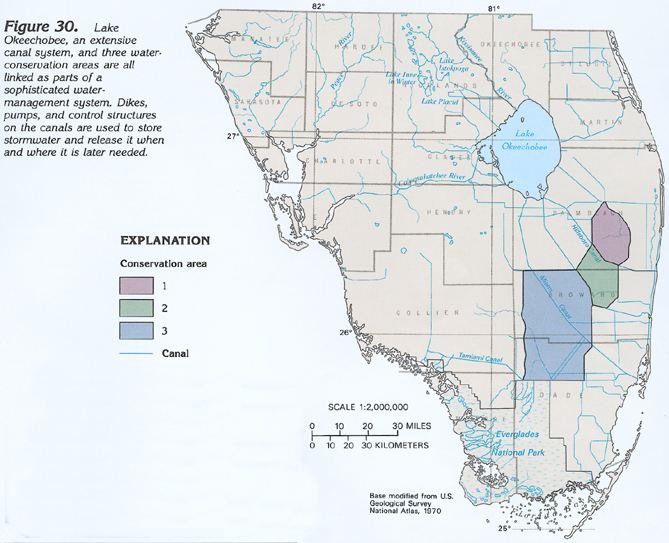
Canals have been used extensively in southern Florida for drainage and flood control. Levees also were constructed, first to prevent flooding from Lake Okeechobee, and subsequently to impound excess water in three large water-conservation areas for later release. These alterations to the natural hydrologic system have culminated in a regional water system; major features of this system are shown in figure 30. The South Florida Water Management District utilizes a system of canals, levees, control structures, pumping stations, and water-conservation (storage) areas (Conservation Areas 1 through 3 in fig. 30) to manage the freshwater resources of southern Florida. The system conserves freshwater, provides flood control, and minimizes saltwater encroachment.
Impoundments, such as the water-conservation areas, provide water to the extensive canal system during dry periods. Seepage from the canals into the Biscayne aquifer during such periods helps maintain the water level in the aquifer. A network of major pumping stations provides flood protection by pumping excess stormwater from canals into the conservation areas. During prolonged droughts, this water is released to maintain canal flow. Natural land-surface elevations and levee heights are such that the overall movement of impounded water is from Lake Okeechobee to Conservation Area 1, and, thence, sequentially to Conservation Areas 2 and 3. Some of the water released from Conservation Area 3 sustains the flow of freshwater into the Everglades National Park.
Canals concentrate and channel what had been natural sheetflow. The drainage of wetlands is perhaps the most important aspect of the canal network, and was the primary reason for canal construction. However, a network of control structures also allows water to be diverted through the canal system to points where it may be needed to help maintain ground-water levels, such as near municipal well fields. Rapid interchange of water from the canals to the Biscayne aquifer is possible in most places because of the high permeability of the aquifer. Control structures near the coast on the major canals are particularly important in helping to prevent encroachment of saltwater into the canals, and subsequently into the aquifer, during periods of less than normal precipitation.
Ground-Water Flow
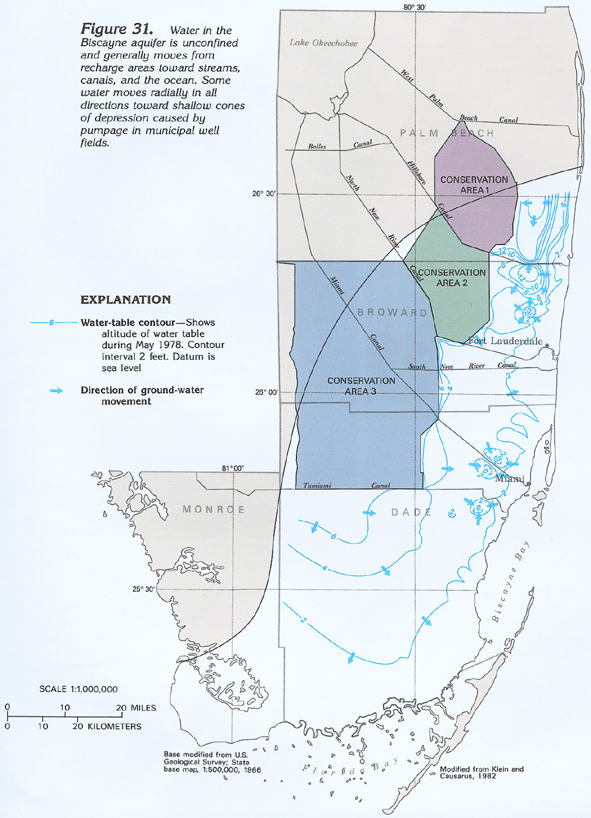
The major features of the flow system in the Biscayne aquifer are shown by a generalized water-table map (fig. 31). The configuration of the water table is a subdued replica of the land surface; that is, the water table is at a higher altitude under hills and at a lower altitude under valleys. The water table fluctuates rapidly in response to variations in recharge (precipitation), natural discharge, and pumpage from wells. Natural discharge is by seepage into streams, canals, or the ocean; by evaporation; and by transpiration by plants.
The contours in figure 31, and the arrows superimposed on them, show that the general movement of water in the Biscayne aquifer is seaward. Water levels are generally highest near the water-conservation areas and lowest near the coast. Contours are not drawn in the conservation areas because they represent impoundments, and, accordingly, there is no slope in the water table there. The effects of natural surface drainage and uncontrolled canals on the water table are shown by the irregular patterns of the contours, particularly where they point upstream in a sharp "V" shape, showing that the aquifer is discharging to the canals. Near the coast, the contours point downstream, showing that the aquifer is being recharged from the canals. The water level of an unconfined aquifer typically is markedly affected by surface drainage.
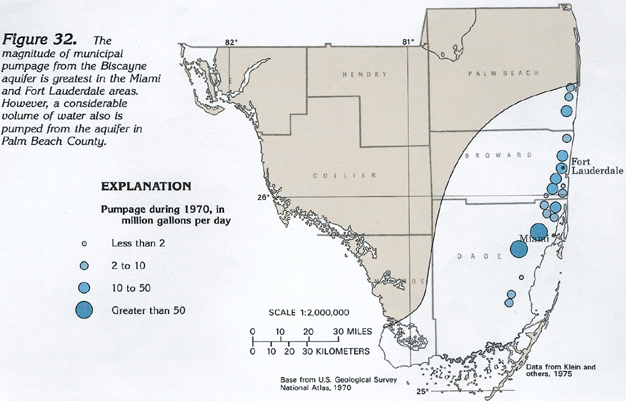
Some of the local variations in the water table are due to other causes. The local high area in eastern Palm Beach County (fig. 31), where the water table is higher than 16 feet, is due to a local topographic high. The closed depressions in eastern Broward and Dade Counties reflect large-scale pumpage from major well fields supplying Miami and Fort Lauderdale (compare figs. 31 and 32). Withdrawal of large volumes of ground water has locally reversed the natural flow direction (note westward-pointing arrows adjacent to depressions), thereby increasing the possibility of saltwater encroachment. The wide spacing of contours in Dade County and southeastern Broward County indicates a slight gradient (slope) in the water table, as compared to a steep gradient to the north where the contours are closely spaced. The wide spacing of contours reflects areas where the Biscayne aquifer consists mostly of highly permeable limestone; permeability is less in the steep-gradient areas where the aquifer is sandier.
Water-Table Fluctuations
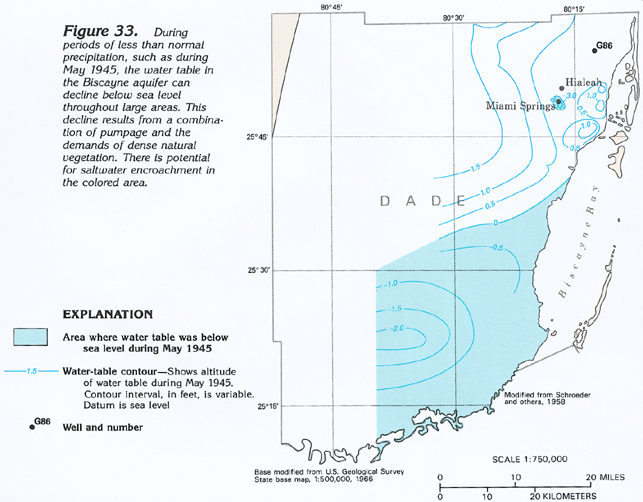
Major fluctuations in the water table of the Biscayne aquifer result from variations in recharge and natural or artificial discharge, or both. Fluctuations may range from 2 to 8 feet per year, depending primarily on variations in precipitation and pumpage. Pumpage is generally greater during periods of less than normal precipitation, as farmers and homeowners apply irrigation water to maintain crop production and lawn growth. Extremely low water-table conditions, such as those shown in figure 33, result from prolonged periods of less than normal precipitation. Total precipitation for the 2 years preceding the date of the water levels shown in figure 33 barely exceeded the long-term average precipitation for a single year. As a result, water levels declined slightly below sea level throughout a large area in southern Dade County, primarily due to transpiration by plants coupled with domestic pumpage. Water levels also were below sea level in a smaller area at Miami Springs, due to pumpage from the municipal well field. Under these conditions, saltwater migrated inland for considerable distances. Most of the drainage canals also were uncontrolled at the time (1940's) represented by figure 33, thus the lowering of the water table; saltwater encroachment was accelerated by continuous drainage to canals.
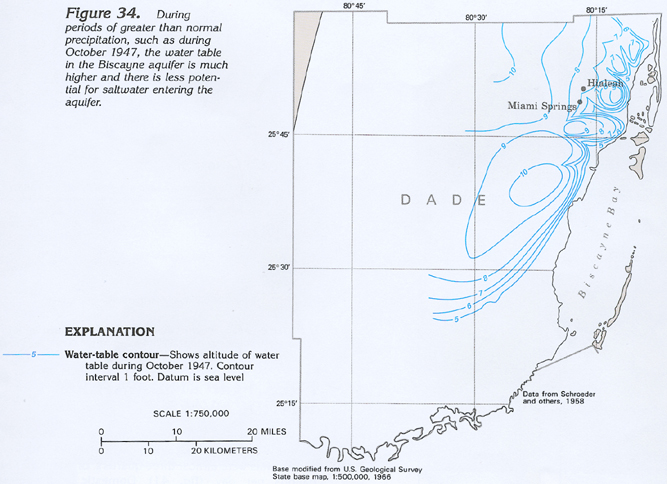
Extensive flooding also occurs during periods of greater than average precipitation, such as that preceding the high-stage water levels of October 1947, shown in figure 34. Water overflowed the banks of many of the canals, and a large part of the inland area was inundated. West of Biscayne Bay, water levels were almost 11 feet higher than those shown in figure 33. In Hialeah, water levels that had declined to about 0.5 foot above sea level in 1945 rose to almost 9 feet above sea level in 1947. The numerous types of control structures in southern Florida were constructed largely to avoid the problems associated with such extreme water-level fluctuations as those indicated by these two figures.
Response to Recharge
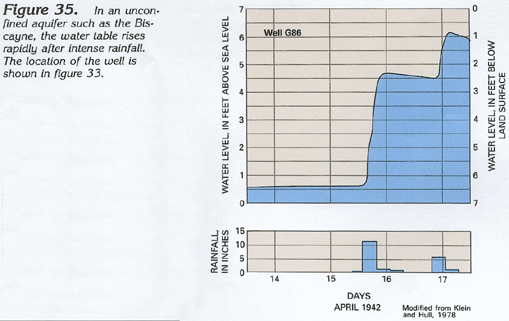
The highly permeable rocks of the Biscayne aquifer are covered in most places only by a veneer of porous soil. Accordingly, water levels in the aquifer rise rapidly in response to rainfall. The rise in the water level in well G-86, located in Miami, following two periods of intense rainfall in April 1942, is shown in figure 35. Eleven inches of rainfall during a 4-hour period in the early morning of April 16 produced a 4.5-foot rise in the water level in the well within a few hours. Six inches of rainfall during the late morning and early afternoon of April 17 was responsible for an additional rise of 1.5 feet in the water level in the well, also within only a few hours.
Canal-Aquifer Connection
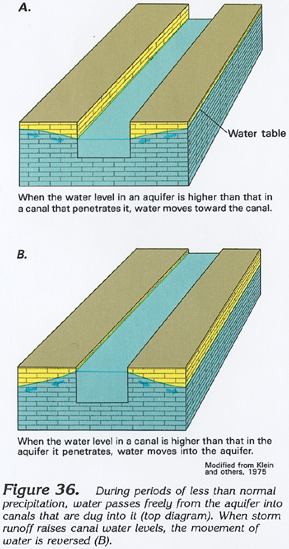
The hydraulic connection between the Biscayne aquifer and the canals that cross it is direct. Water passes freely from the canals into the aquifer and vice versa. A decline in the water level of a canal lowers the adjacent water table of the aquifer almost immediately. Similarly, a rise in the water level in a canal is rapidly followed by a rise in the water table of the aquifer adjacent to the canal. These canal-aquifer water-level relations are shown schematically in figure 36. The arrows show the direction that water moves when the water level of the canal is lower (fig. 36A) and higher (fig. 36B) than the water table in the aquifer. The degree of connection decreases as fine sediment settles out of the canal water and lines the canal bottom. Accordingly, the degree of connection may change from time to time because of either accumulation of these sediments or their removal during runoff from intense storms.
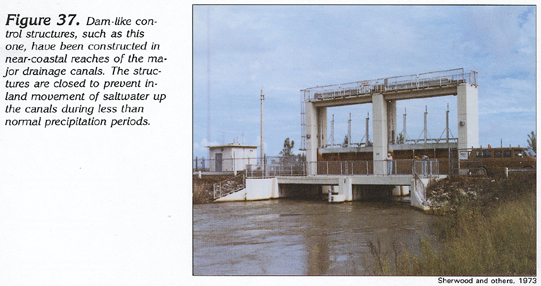
The hydraulic connection between the canals and the aquifer results in both benefits and problems. Perhaps the most obvious benefit is the ability of the canals to rapidly remove excess surface and ground water, thereby preventing flooding in low-lying interior areas. A more subtle benefit is the ability to move water from inland parts of the aquifer to coastal areas through the canals, allowing ground-water levels near the coast to remain high enough to retard saltwater encroachment during periods of less than normal precipitation. Problems also can result from the direct hydraulic connection. For example, aquifer contamination by any pollutants in the canal water can be both rapid and widespread. In addition, the canals provide channels by which saltwater can encroach into the aquifer for considerable distances inland during periods of low water. The latter problem has been greatly alleviated by the construction of large-scale canal control structures near the coastal ends of the major canals (fig. 37). These structures prevent the movement of saltwater up the canals when water levels in the canals are low.
SALTWATER ENCROACHMENT
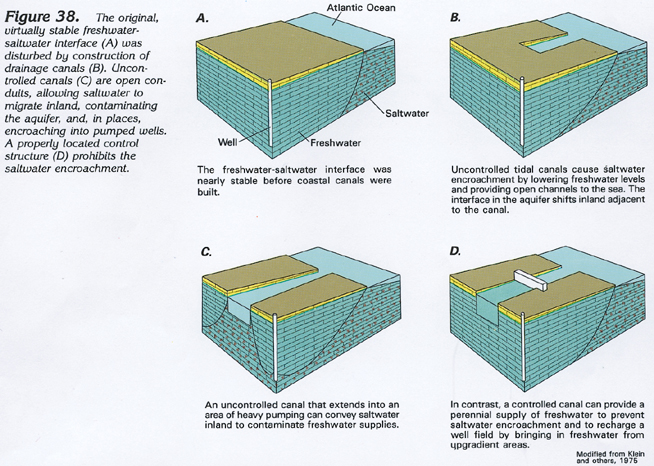
The delicate natural balance between freshwater and saltwater in the Biscayne aquifer is tipped when canals and well fields are superimposed on it. Where a highly permeable aquifer, such as the Biscayne, is hydraulically connected to the ocean, inland movement of saltwater is offset by a slightly higher column of freshwater. Because freshwater is lighter than saltwater, a 41-foot column of freshwater is necessary to balance a 40-foot column of saltwater. This means that, for each foot of freshwater above sea level, there is approximately a 40-foot column of freshwater below sea level. Accordingly, lowering of freshwater levels by drainage canals or by intensive pumping creates an imbalance that causes the inland movement of saltwater.
How saltwater can encroach coastal areas as a result of development is shown diagrammatically in figure 38. In the natural, balanced condition shown in figure 38A, saltwater is present only near the shoreline and is balanced by a thick inland column of freshwater. Construction of a drainage canal, however (fig. 38B), lowers freshwater levels and allows landward movement of saltwater in the canal and aquifer. In addition, the canal becomes a tidal channel that conveys saltwater inland and, thence, laterally into the Biscayne aquifer. Where municipal well fields withdraw large quantities of ground water, the water level in the aquifer is lowered still farther, and saltwater can enter the well field (fig. 38C). Some coastal well fields have been abandoned for this reason. Control structures (fig. 38D) placed near the coast dam the water in the canal, thus, artificially raising water levels in both the canal and the adjacent aquifer. Thus, further saltwater encroachment is prevented and, in some instances, has even been reversed.
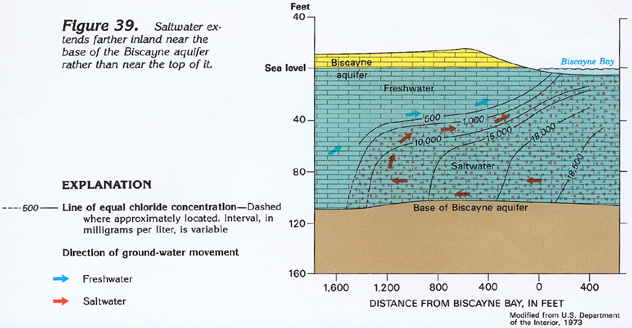
The saltwater body in the aquifer is approximately wedge-shaped, as shown in figure 39, being thickest near the coast and tapering inland. Therefore, the maximum inland extent of saltwater is located near the base of the aquifer. The cross section shown in figure 39 represents conditions near Biscayne Bay, where the aquifer is highly permeable and free interchange of freshwater and saltwater is possible. Farther northward, especially in Palm Beach County, the Biscayne aquifer is sandy and less permeable, and saltwater encroachment does not extend as far inland. The exact position of the saltwater front, defined by a chloride concentration of 1,000 milligrams per liter, varies in response to the height of freshwater in the aquifer, which in turn varies directly with precipitation. Movement of the saltwater front is inland and upward in response to low ground-water levels and seaward and downward in response to high ground-water levels. The arrows in figure 39 show that freshwater at the bottom of the aquifer flows upward and then discharges seaward along the saltwater front.
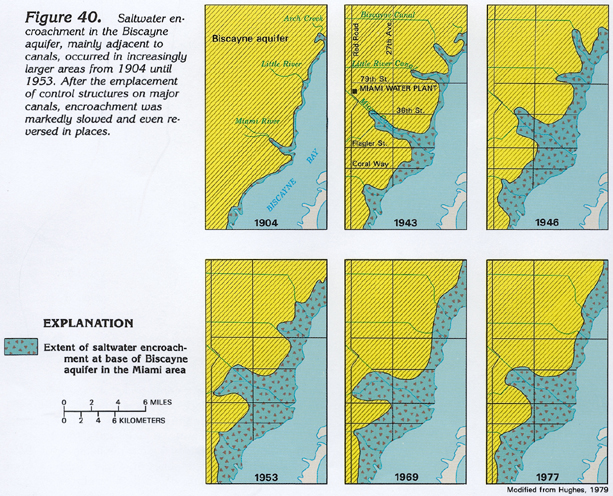
The sequence of maps in figure 40 shows the inland movement of saltwater in the Biscayne aquifer in response to development. The colored area on all the maps shows the inland extent of saltwater at the base of the aquifer. Under natural conditions, as shown by the 1904 map, saltwater was limited to a narrow band along the coastline and to short tidal reaches of natural water courses. Urban and agricultural development and the resulting drainage of the land had not yet begun. Before 1946, canal flow was virtually uncontrolled and groundwater levels were greatly lowered because of extensive pumpage. The threat of contamination of inland municipal well fields spurred remedial action. Salinity-control structures were constructed in coastward reaches of the major canals and halted or reversed saltwater encroachment, particularly adjacent to the canals (compare the 1953 and 1969 maps of fig. 40). By 1977, additional control structures and effective water-management practices had reduced the area of saltwater contamination considerably from its maximum extent in 1953.
SUSCEPTIBILITY TO CONTAMINATION
Because the Biscayne aquifer is highly permeable and is at or near the land surface practically everywhere, it is readily susceptible to ground-water contamination. Because of the high permeability of the aquifer, most contaminants are rapidly flushed. Major sources of contamination are saltwater encroachment and infiltration of contaminants carried in canal water. Additional sources include direct infiltration of contaminants, such as chemicals or pesticides applied to or spilled on the land, or fertilizer carried in surface runoff; landfills; septic tanks; sewage-plant treatment ponds; and wells used to dispose of storm runoff or industrial waste. Most disposal wells are completed in aquifers containing saltwater that underlie the Biscayne aquifer, but they are a potential source of contamination where they are improperly constructed. Numerous hazardous-waste sites have been identified in the area underlain by the Biscayne aquifer, and three unlined landfills are known to have contaminated the aquifer. Remedial action to prevent further contamination is underway at many of these sites.
Uncontaminated water in the Biscayne aquifer is suitable for drinking and most other uses. The water is hard, is a calcium bicarbonate type, and contains small concentrations of chloride and dissolved solids. Locally, the water contains large concentrations of iron. In places in southern Broward County and northern and central Dade County, the water is darkly colored, reflecting large concentrations of organic material.
FRESH GROUND-WATER WITHDRAWALS
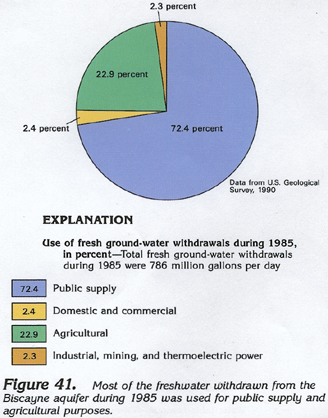
Withdrawals of freshwater from the Biscayne aquifer during 1985 totaled 786 million gallons per day. Public-supply withdrawals were almost three-quarters, or about 569 million gallons per day, (fig. 41). Domestic and commercial withdrawals were about 19 million gallons per day. Agricultural withdrawals were about 180 million gallons per day. Withdrawals for industrial, mining, and thermoelectric-power uses were about 18 million gallons per day.